

题目
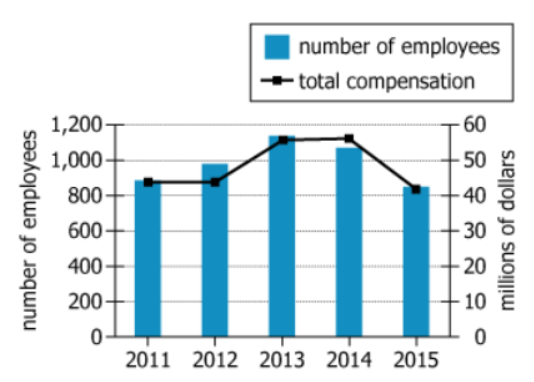
For each year from 2011 through 2015, the graph shows the number of employees of a certain company during that year, together with the total amount paid by the company in compensation to its employees during that year.
Select from each drop-down menu the option that completes the statement so that it has the most support from the information provided.
The year in which the average (arithmetic mean) annual compensation per employee was GREATEST was {【下拉选项标识】}
The year in which the average (arithmetic mean) annual compensation per employee was LEAST was {【下拉选项标识】}
解析
从2011年到2015年的每一年,该图表展示了某公司在该年的员工数量以及该公司在该年支付给员工的总报酬金额。
平均(算术平均)每位员工的年度报酬最高的年份是:
A. 2011
B. 2012
C. 2013
D. 2014
E. 2015
平均(算术平均)每位员工的年度报酬最低的年份是:
A. 2011
B. 2012
C. 2013
D. 2014
E. 2015
第1小空(平均每位员工年度报酬最高的年份)
不用计算,当总报酬量超过员工数量时,平均报酬为最高; 通过比较可知2014年平均每位员工的年度报酬最高,所以答案是D。
第2小空(平均每位员工年度报酬最低的年份)
同样根据上述方法:总报酬离员工数量的顶点越远,均薪越少;2012年平均报酬确实最低,所以答案是B。
 在线客服
在线客服 官方微信
官方微信 公众号
公众号