

题目
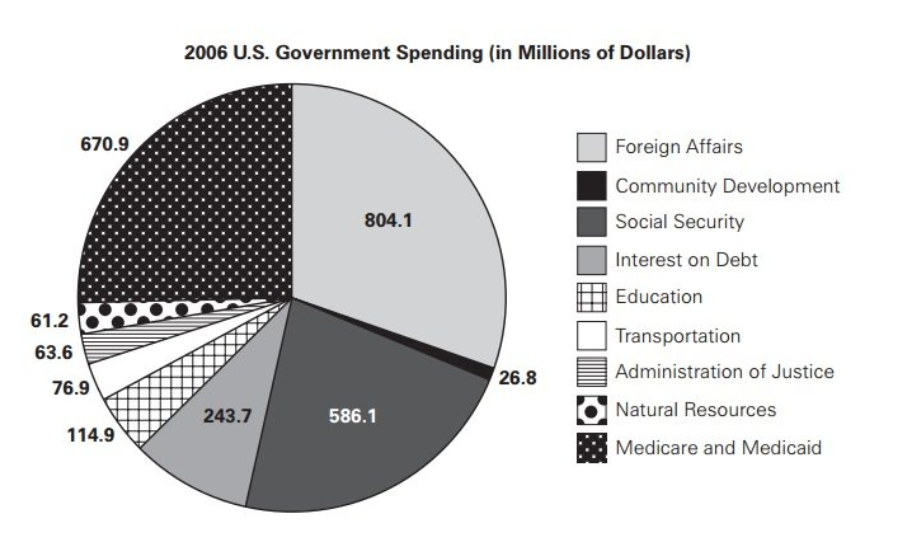
The graph above is a circle graph with 9 sectors, each representing an area in which the U.S. government spent money (in millions of dollars) during the 2006 fiscal year.
Use the drop-down menus to fill in the blanks in each of the following statements based on the information given by the graph.
1. If Medicare and Medicaid spending in 2005 were $824,400,000, spending in this sector approximately {【下拉选项标识】} from 2005 to 2006.
2. The sectors of {【下拉选项标识】}comprise approximately 25% of the total amount spent by the U.S. Government in 2006.
解析
上述图形是一个圆形图,有9个扇形区域,每个区域代表美国政府在2006财年的一个支出领域(以百万美元计)。
1. 如果2005年医疗保险和医疗补助(Medicare and Medicaid)支出为824,400,000美元,从2005年到2006年该领域的支出大约________。
A选项:增加了22.88%
B选项:减少了22.88%
C选项:增加了18.62%
D选项:减少了18.62%
E选项:没有变化
计算2006年Medicare and Medicaid的支出增长比例
根据图表可知,2006年Medicare and Medicaid的支出为670.9百万美元,2005年为824.4百万美元(824400000美元换算为百万美元)。
增长或减少的百分比计算公式为=[(新值-旧值)/旧值]×100%
即减少了18.62%
2. ________这些领域大约占美国政府2006年总支出的25%。
A选项:社会保障(Social Security)和债务利息(Interest on Debt)
B选项:医疗保险和医疗补助(Medicare & Medicaid)以及社区发展(Community Development)
C选项:债务利息(Interest on Debt)、教育(Education)、司法管理(Administration of Justice)和交通运输(Transportation)
D选项:社会保障(Social Security)和教育(Education)
E选项:社会保障(Social Security)和交通运输(Transportation)
2006年总支出:670.9+804.1+61.2+63.6+76.9+243.7+586.1+26.8+114.9 = 2648.2(百万美元)
25%是662.05,这大致等于社会保障(586.1)和交通(76.9)的总和
所以正确选项为E
 在线客服
在线客服 官方微信
官方微信 公众号
公众号